- Product
- Infrastructure Monitoring
- Network Performance Monitoring
- Network Device Monitoring
- Container Monitoring
- Serverless
- Cloud Cost Management
- Cloudcraft
- Log Management
- Sensitive Data Scanner
- Audit Trail
- Observability Pipelines
- Application Performance Monitoring
- Universal Service Monitoring
- Continuous Profiler
- Database Monitoring
- Data Streams Monitoring
- Service Catalog
- Dynamic Instrumentation
- Software Composition Analysis
- Application Security Management
- Cloud Security Management
- Cloud SIEM
- Browser Real User Monitoring
- Mobile Real User Monitoring
- Synthetic Monitoring
- Mobile App Testing
- Session Replay
- Error Tracking
- CI Pipeline Visibility
- Test Visibility & Intelligent Test Runner
- Continuous Testing
- Bits AI
- OpenTelemetry
- Workflow Automation
- CoScreen
- Dashboards
- Watchdog
- Alerts
- Incident Management
- Integrations
- IDE Plugins
- API
- Case Management
Infrastructure
Logs
Applications
Security
Digital Experience
Software Delivery
Platform Capabilities
- Customers
- Pricing
- Solutions
- Financial Services
- Manufacturing & Logistics
- Healthcare/Life Sciences
- Retail/E-Commerce
- Government
- Education
- Media & Entertainment
- Technology
- Gaming
- Amazon Web Services Monitoring
- Azure Monitoring
- Google Cloud Platform Monitoring
- Kubernetes Monitoring
- Red Hat OpenShift
- Pivotal Platform
- OpenAI
- SAP Monitoring
- OpenTelemetry
- Cloud Migration
- Monitoring Consolidation
- Unified Commerce Monitoring
- DevOps
- Shift-Left Testing
- Digital Experience Monitoring
- Security Analytics
- Compliance for CIS Benchmarks
- Hybrid Cloud Monitoring
- IoT Monitoring
- Machine Learning
- Real-Time BI
- On-Premises Monitoring
- Log Analysis & Correlation
Industry
Technology
Use-case
- About
- Blog
- Docs
- Login
- Get Started Free
See across systems, apps, and services
With turn-key integrations, Datadog seamlessly aggregates metrics and events across the full devops stack.
- SaaS and Cloud providers
- Automation tools
- Monitoring and instrumentation
- Source control and bug tracking
- Databases and common server components
- All listed integrations are supported by Datadog
Get full visibility into modern applications
Monitor, troubleshoot, and optimize application performance.
- Trace requests from end to end across distributed systems
- Track app performance with auto-generated service overviews
- Graph and alert on error rates or latency percentiles (p95, p99, etc.)
- Instrument your code using open source tracing libraries
Analyze and explore log data in context
Quickly search, filter, and analyze your logs for troubleshooting and open-ended exploration of your data.
- Automatically collect logs from all your services, applications, and platforms
- Navigate seamlessly between logs, metrics, and request traces
- See log data in context with automated tagging and correlation
- Visualize and alert on log data
Proactively monitor your user experience
End-to-end user experience visibility in a single platform.
- Monitor critical user journeys captured with an easy-to-use web recorder
- Save engineering resources with AI-powered, self-maintaining tests
- Detect and alert on performance issues for users in various locations
- Manage your SLAs and SLOs

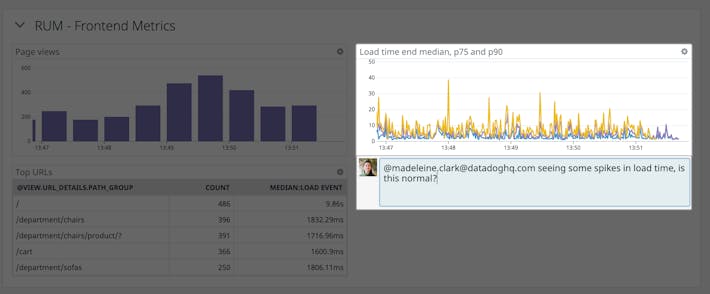
Correlate frontend performance with business impact
Prioritize business and engineering decisions with user experience metrics.
- Visualize load times, frontend errors, and resources for every user session
- Slice and dice data using custom attributes
- Troubleshoot quickly with frontend, backend and business metrics in one view

Visualize traffic flow in cloud-native environments
Understand performance using meaningful, human-readable tags.
- Use tags to filter traffic by source and destination
- Group by anything — from datacenters to teams to individual containers
- Report key metrics such as traffic volume and TCP retransmits

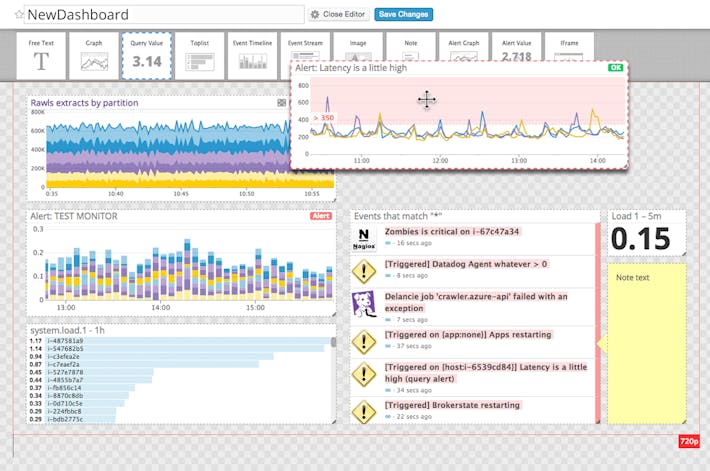
Build real-time interactive dashboards
More than summary dashboards, Datadog offers all high-resolution metrics and events for manipulation and graphing.
- See graphs across sources in real-time
- Slice data by host, device, or any other tag
- Compute rates, ratios, averages or integrals
- Easily customize views, interactively or in code
Share what you saw, write what you did
System events and metrics are only part of the story. Datadog is built to give visibility across teams.
- Discuss issues in-context with production data
- Snapshot potential issues and notify your team
- See who responded to that alert before
- Remember what was done to fix it
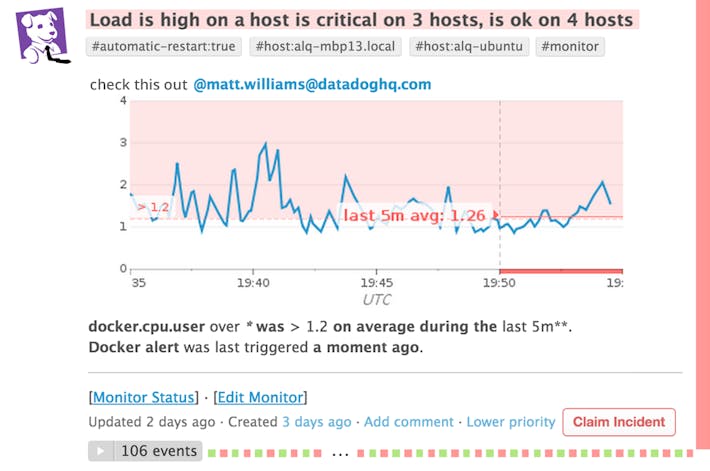
Get alerted on critical issues
Datadog notifies you of performance problems, whether they affect a single host or a massive cluster.
- Receive alerts on any metric, for a single host or for an entire cluster
- Get notifications via e-mail, PagerDuty, Slack, and other channels
- Build complex alerting logic using multiple trigger conditions
- Mute all alerts with 1 click during upgrades and maintenance
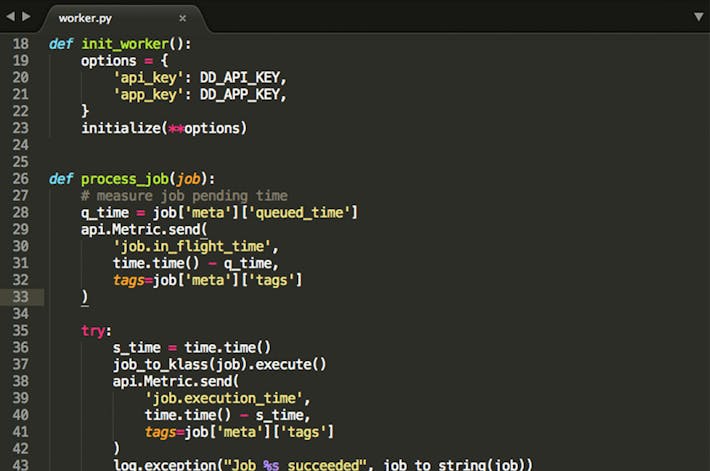
Instrument your apps, write new integrations
Datadog includes full API access to bring observability to all your apps and infrastructure.
- Capture events and metrics from your own applications using our client libraries
- Tag servers or query Datadog in command-line
- Generate and upload JSON-formatted dashboards
- Use our Restful HTTP API for full data access